
Counter Log
Counter Log stores counter values and displays data across different time intervals.
Counter log
Tutorial video
Counter Log stores counter values and displays data across different time intervals.
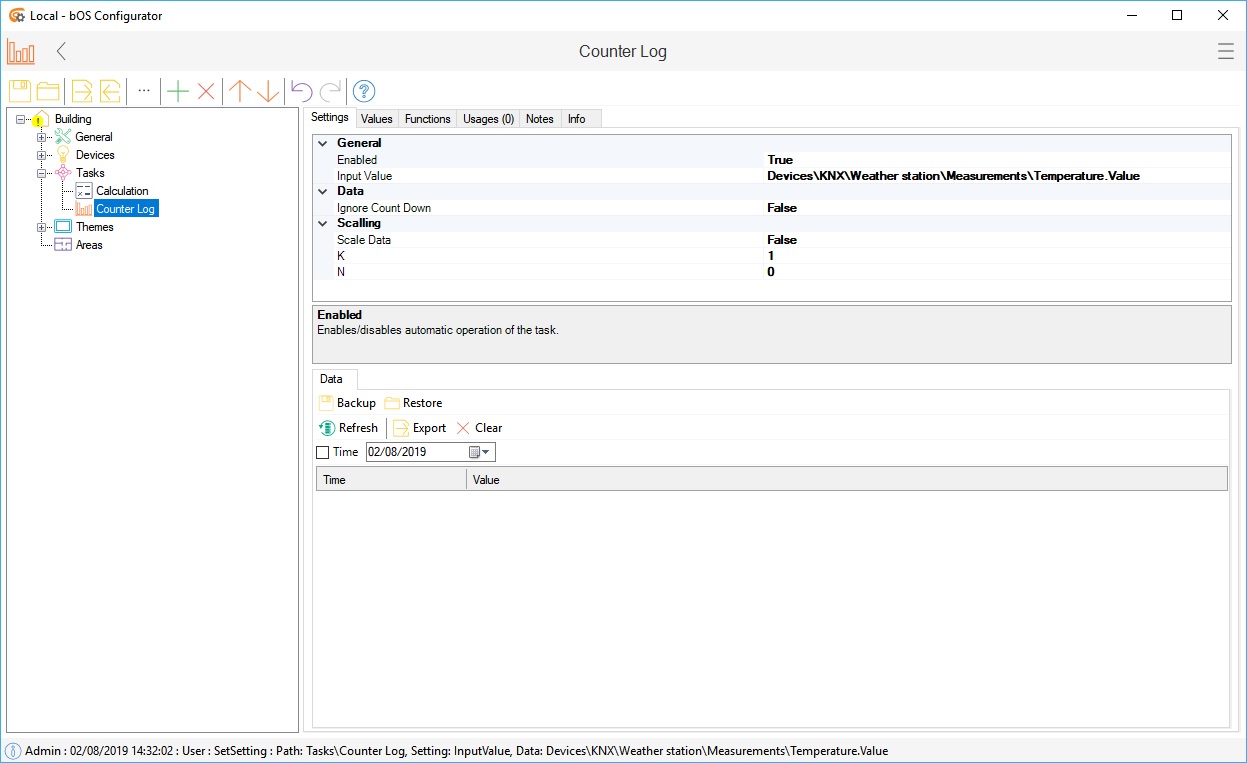
Picture 1: Counter log node
Input Value can be linked to any object value of type double, integer and boolean. If the input value is boolean type, then the number of impulses (lead edge switching) is counted.
Ignore Countdown setting prevents writing the negative counter values to database (e.g. when the meter is reset to 0). Filter Counter Resets function can be used when meter measuring the input values is replaced with new one or is reset to zero. This will create an inconsistency in the measured data (will be calculated as change in consumption). By calling the Filter Counter Resets the database is rewritten to compensate for the change.
Data can be scaled (Scaling) before it is written to database.
Multiple calculated values (Total Value, Last 24 Hours, Today Count, Yesterday Count, Daily Average, This Month Count, Previous Month Count, Monthly Average *) are available for user interface display or to use in other tasks (e.g. in *Program task to alert users of high consumptions or to send monthly consumption reports).
Entries are displayed under Data tab and it can be backed up, restored, exported and filtered using buttons in the toolbar.
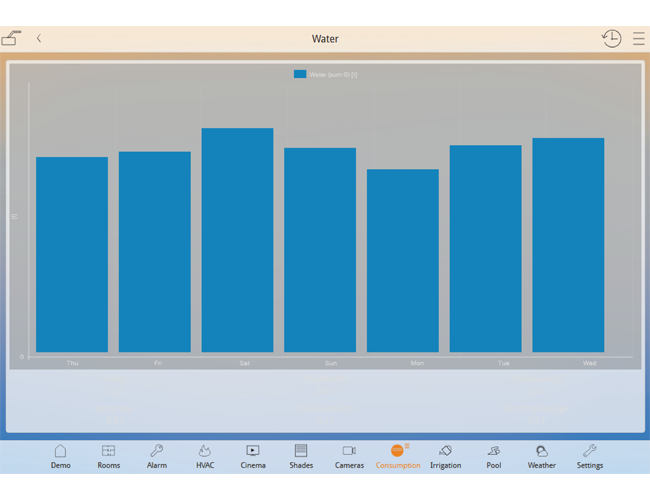
Picture 2: Counter log UI
Multiple logging data can be combined on one plot control. Use buttons in the top right corner to export (Excel or Database file), delete or refresh data
Examples
Download example from our Library: Counter Log
Example 1: Logging electricity consumption
Use electricity consumption for Input value (e.g. kWh meter).
Make the UI control.
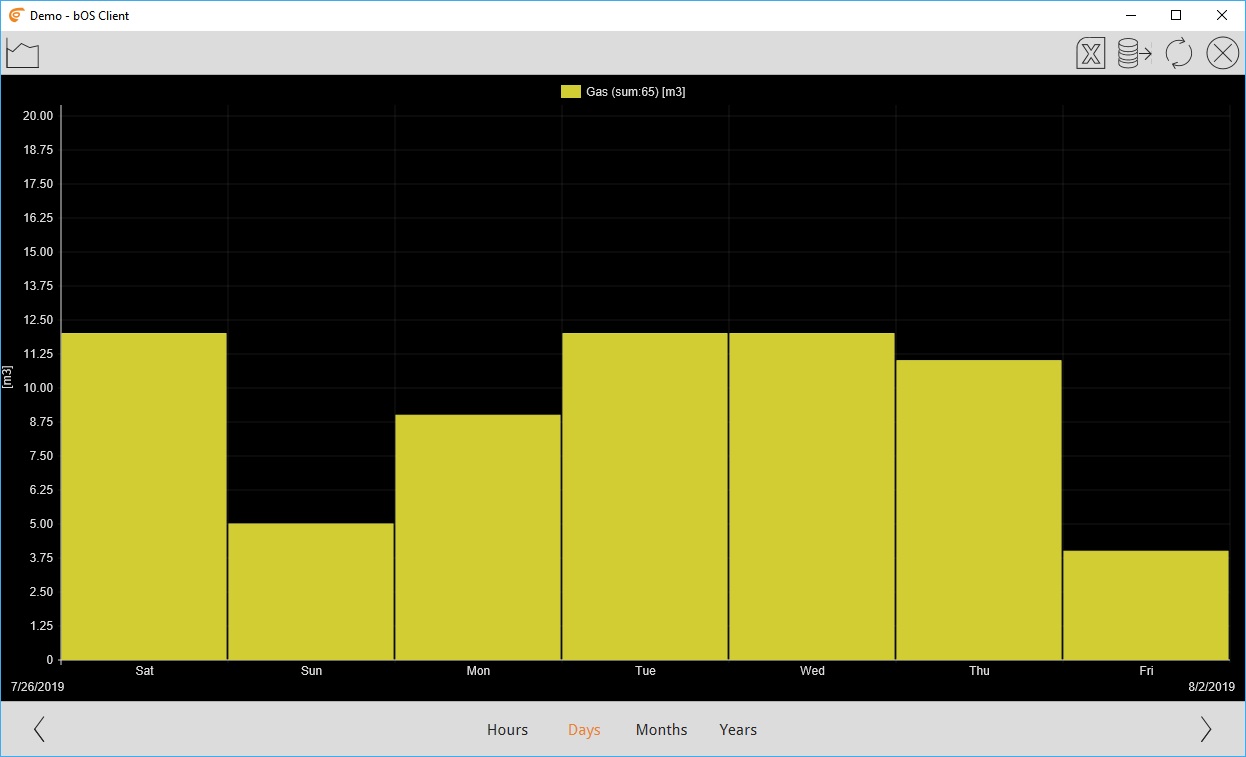
Example 2: Logging gas consumption from impulse meter
Use impulse meter for Input value (e.g. impulse meter 1m3 = 100imp).
Scale the data to log the value in correct units (e.g. to get m3, K = 0.01) .
Make the UI control.
Example 3: Monthly energy report
Use consumption for Input value.
Create Program task. Add Run command, select Send Mail function from the user node. Generate an energy report text including the calculated values in the text.
Create a Schedule task. Add Run command, select Program task from step 2. Set event repeat type to Monthly and set the day of month to send the report.

